Saturday, April 10, 2010

Idaho Rainfall Maps

The first map, near the bottom, shows annual precipitation in Idaho using the inverse-distance weighting method, the second map, to the right, shows the same data using the Kriging method, while the maps are relatively similar, there are a few noticeable differences. On the Kriging method map, the contour lines are much smoother then they are on the Inverse-Distance map and the change in shade which shows the level of precipitation, is much more gradual in this map, also in the Kriging map much more area in the map lies below the lowest contour value of 10, and much more area in the map lies above the highest contour value of 40, But, the range in values is slightly greater in the Inverse-Distance map. Both maps show that the Northern portion of Idaho receives much more precipitation then Southern Idaho. And the amount of precipitation is especially high in the Rocky Mountains near the Montana border.


Saturday, April 3, 2010

Map of the Week April 4-April 10

This is a map of Europe 
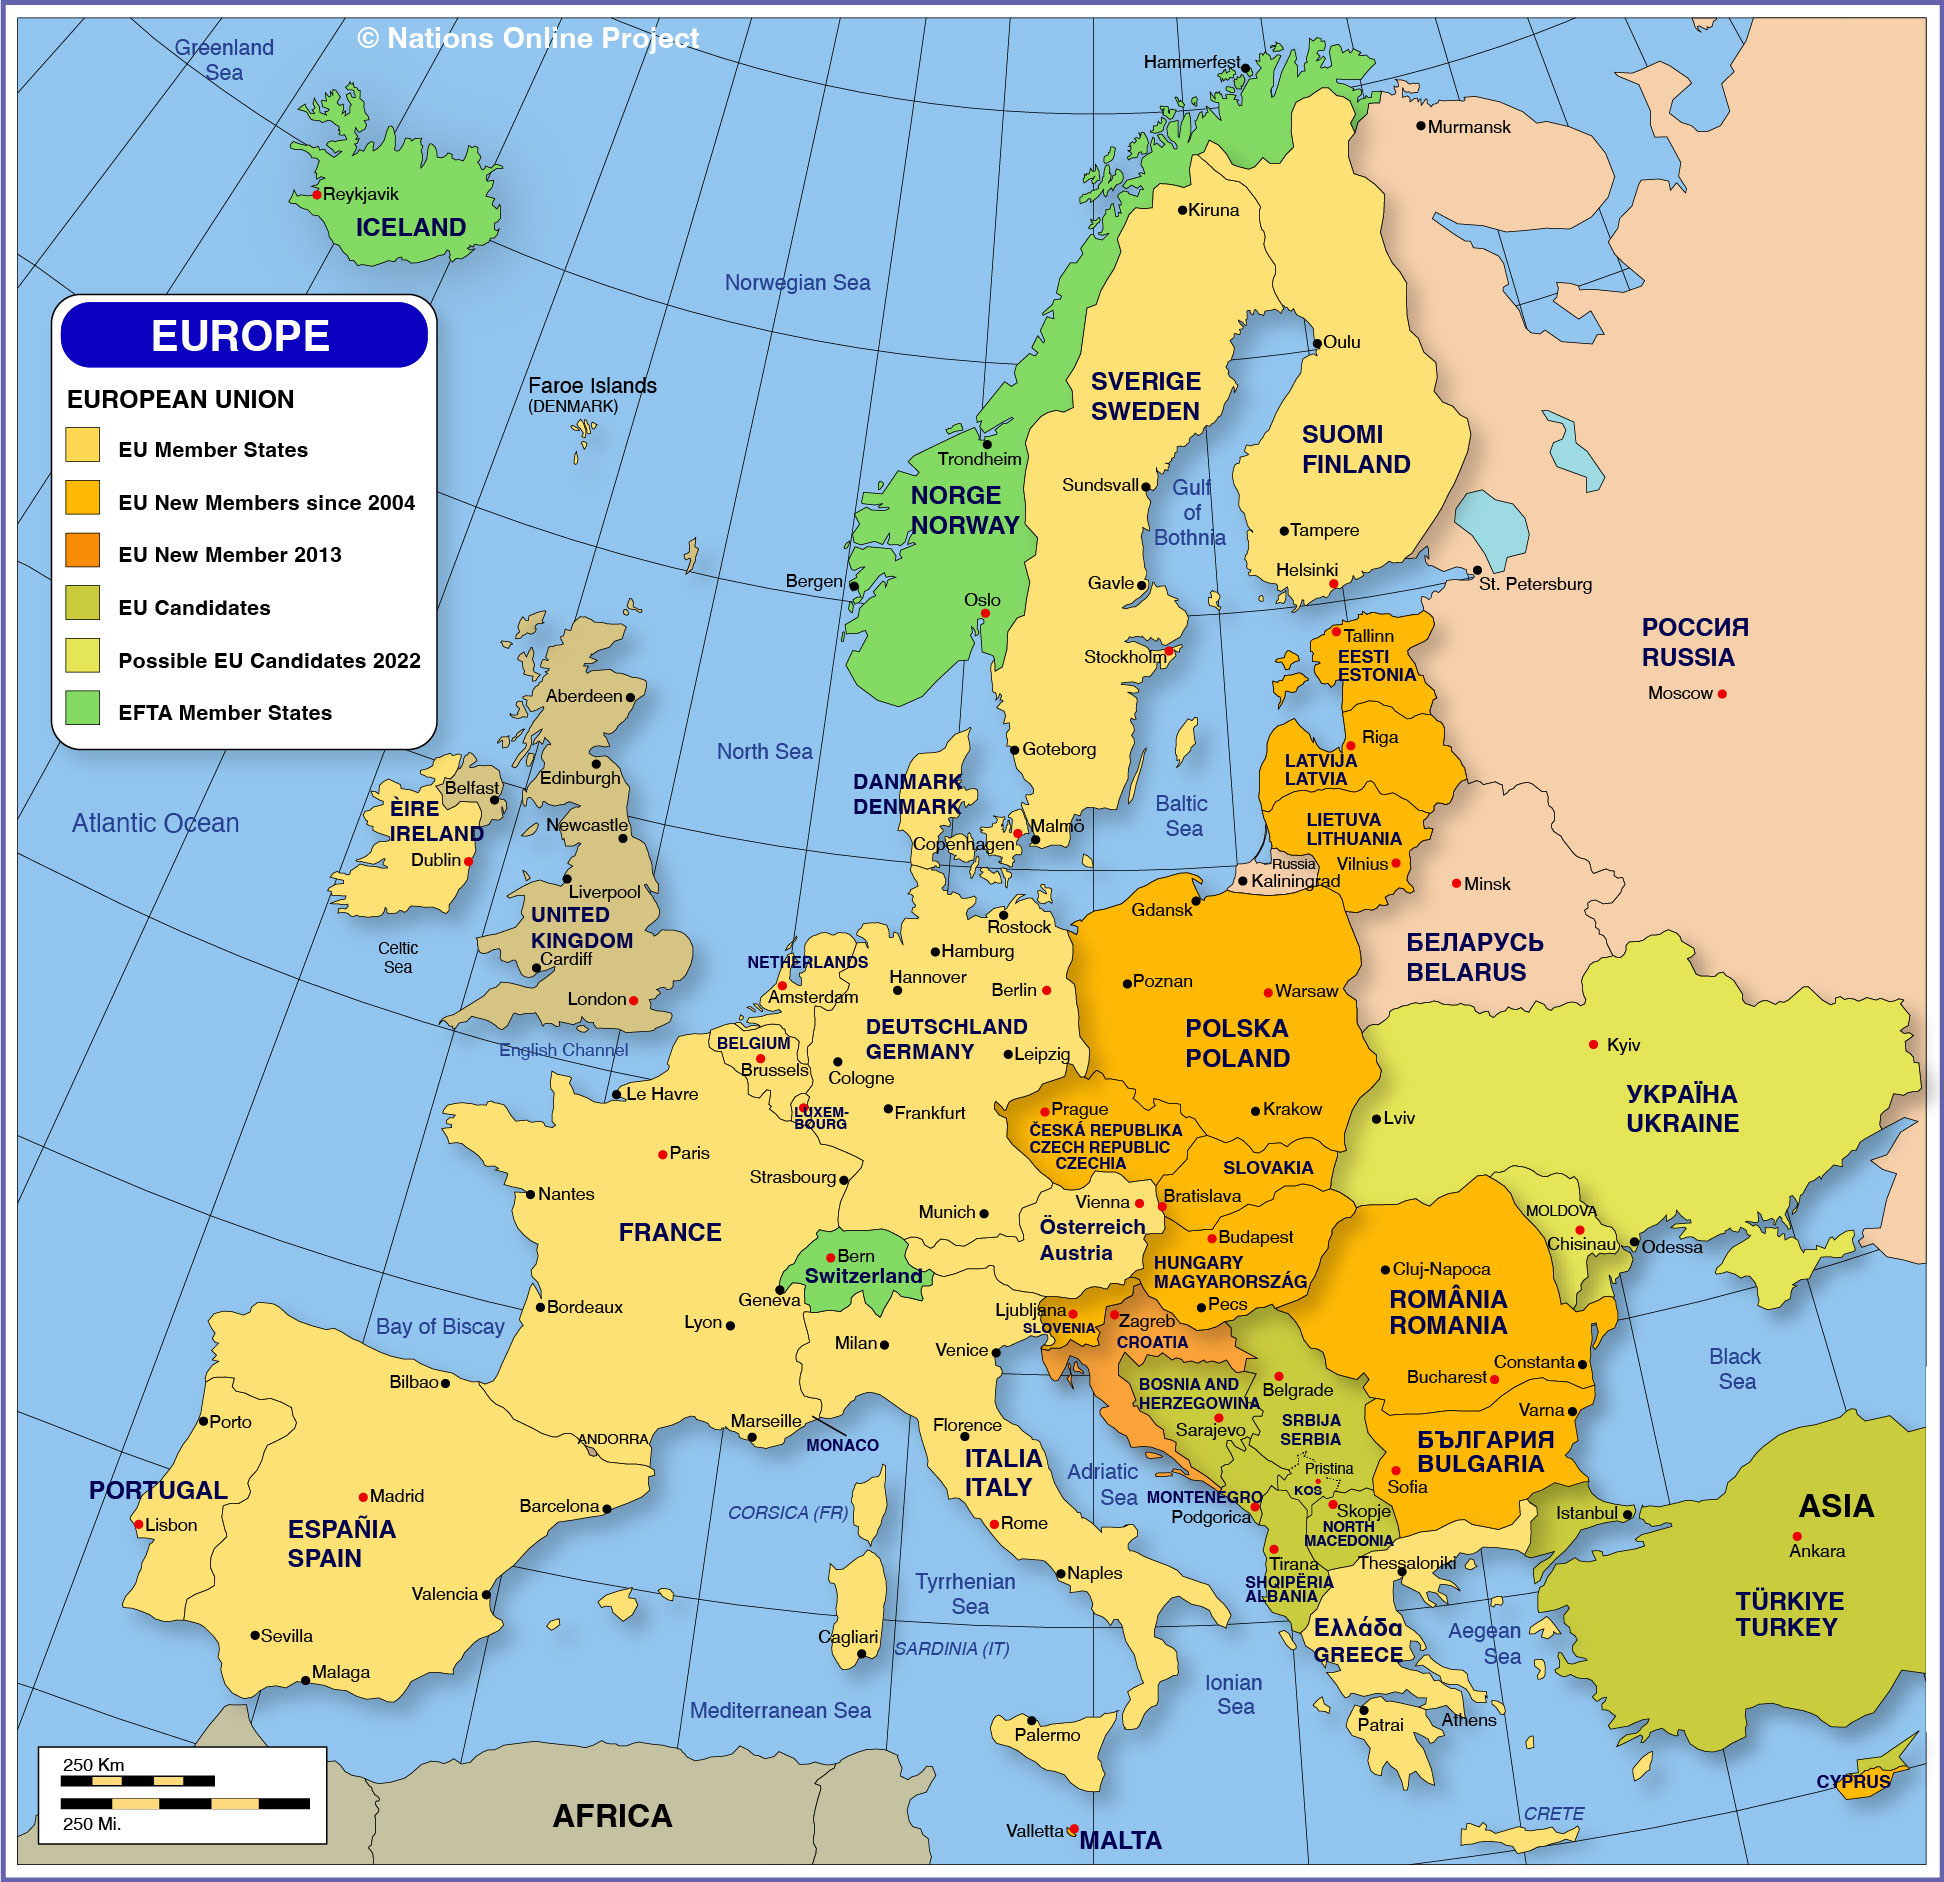
showing EU member nations and which nations were added as members members in 2004 and 2007 it also shows EU candidate nations and EFTA member nations

Monday, March 29, 2010

Map of the week-March 26-April 3

This is a map from political maps.org showing the districts for the US house of representatives, the districts represented by democrats are red and those represented by republicans are blue.

Wednesday, March 10, 2010

Map 6- Rural population in Idaho


The first figure is my original set of maps showing the proportion of the population of regions in Idaho living in rural areas, displayed using several different classification schemes. The second figure is my edited version of these maps. One change I made was changing the labeling at the top of the legend on each map from “Rural Population” to the name of the classification method being used for that map; therefore the audience has a way to tell which map uses which classification scheme. Also I moved the scale bar and credits towards the center to make the map look more organized, and finally I added a title to the set of maps.


Map 5-Boulder County, Colorado


The map of the left is my original map of Boulder County, Colorado. The one on the right is my edited version. I added halos on the labels of cities which went over the highways so that the city labels could clearly be seen. I also changed the color of the cities from gray to yellow so that they would stand out more. And I changed the width of the park boundaries so that they would be thinner then the county boundaries, becuase the park boundaries are not as important. And finally, I labelled the Peak to Peak highway and the Indian Peaks Wilderness.


Map 4-Generalization of Rivers


These maps show the rivers around the Nez Perce reservation generalized with different methods, the original map is on the right and the new map is on the right, for the new map I added an inset showing a large-scale view of one of the rivers so the distinction between the generalization methods can be seen for that rivers. Also, I rearranged the Legend, North Arrow and Scale Bar to reduce the amount of white space, which was difficult to do for this map.

Map 3-Nez Perce


The map on the right shows the change in the territory of the Nez Perce tribe from 1855 to the present and it shows the major decline in land ownership over that period. The map on the left this is an edited version of this map. I made several changes to this map. I rearranged the map elements slightly to be more spaced apart, since in the original map many of the map elements were bunched up against each other, the map elements also look more organized in the way they are rearranged. Like the second Buffalo map I changed the color scheme to a sequential scheme with different shades of blue, lighter reflecting an earlier time period, and darker being more recent. In addition, I added halos to the town names and added the credits.